
The SAP HANA Database & Analytics organization has not yet celebrated its first anniversary of using SAP Digital Boardroom, but already counts itself among the company’s internal end-to-end steering dashboards with the highest user numbers.
When Christian Cramer, chief operating officer (COO) for SAP HANA Database & Analytics, and his team started building the concept, they had one objective: to help stakeholders taking fact-based and reliable business decisions in a dynamic environment, based on one single source of truth offering a 360-degree view of the business and the entire product life cycle – from development to sales and product performance, customer insights, and engagement, along with operational and organizational data.
The team’s ambition has succeeded. Thanks to the collaboration with the SAP Intelligent Data & Analytics team and as internal usage statistics show, SAP employees have widely adopted the solution. Take a peek behind the scenes to understand how it works, what lies behind its success, and what is yet to come.
Three Keys to a Successful Business Dashboard
Building a successful business dashboard requires three crucial ingredients, according to Cramer: a great product, meaningful data, and easy usability.
1. “Only with a great product, will you be able to build a great dashboard”
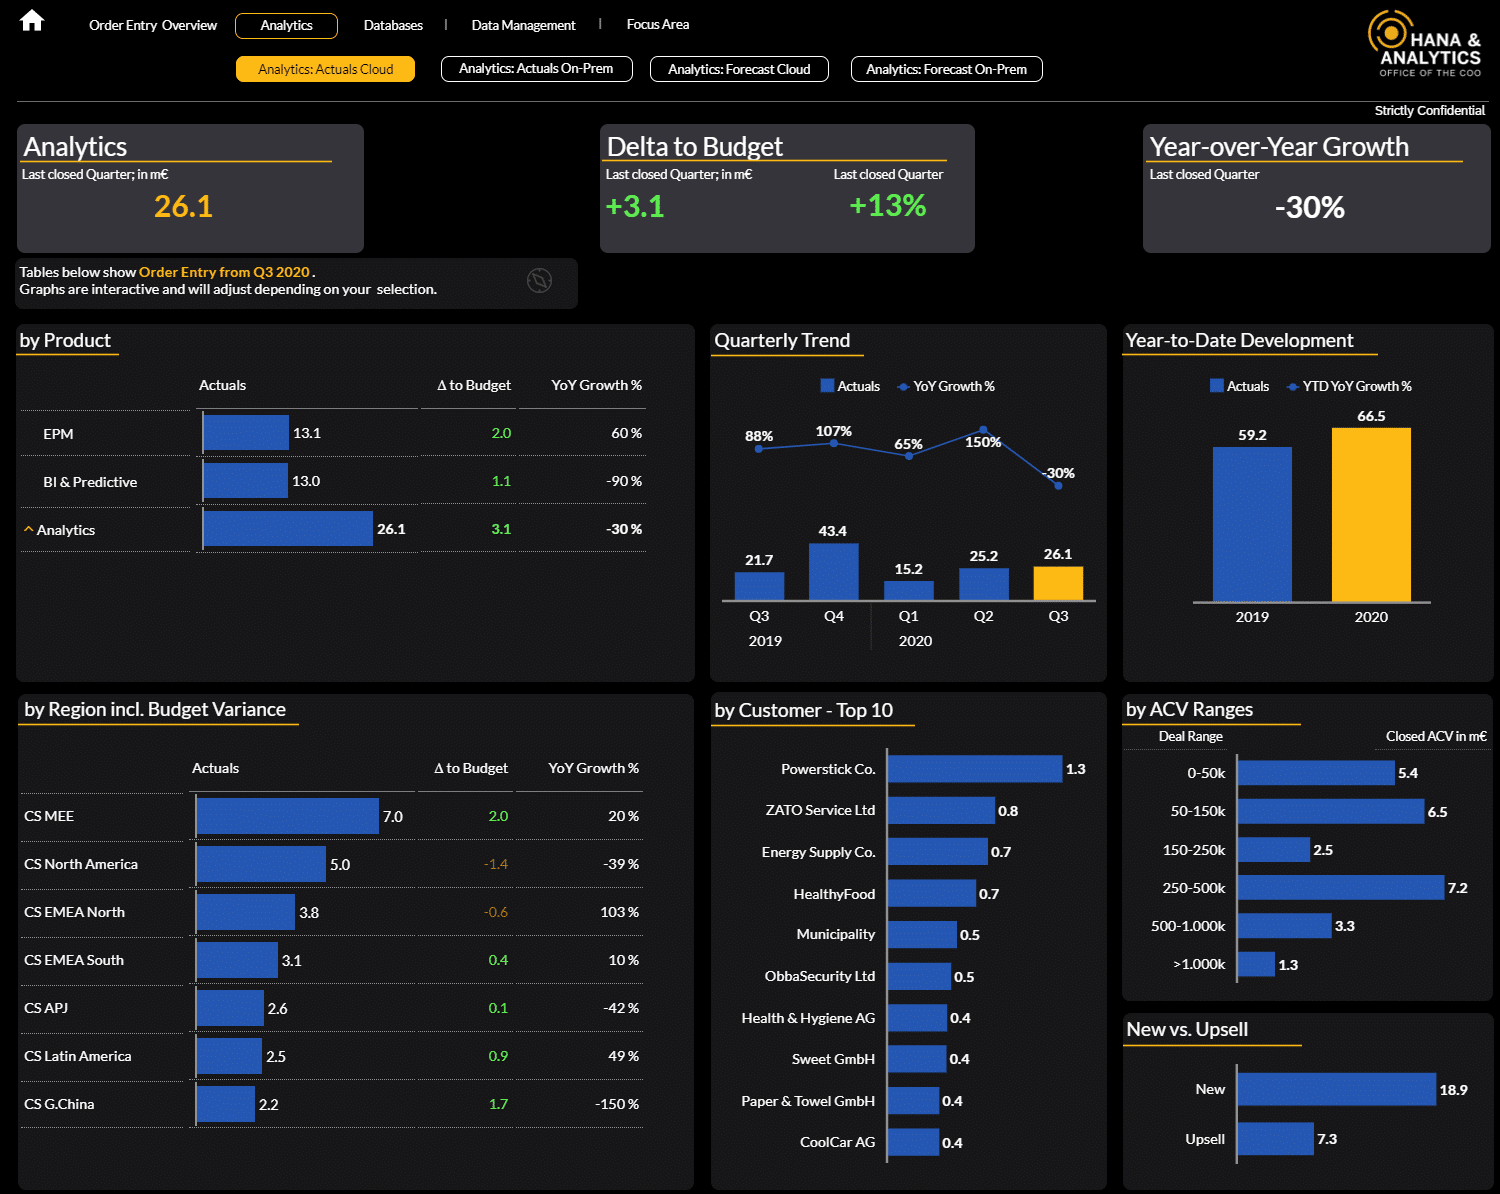
Making use of their own SAP Analytics Cloud product, the team started building an interactive dashboard using SAP Digital Boardroom. With only basic technical background, but thanks to the products’ ease of use, all relevant data was swiftly connected, and more and more content views that were regularly needed by management were added.
As the content grew, more users were introduced to the team’s dashboard. Word spread fast and teams reached out to have their own content added as well.
Daniel Pavlovic is part of the operations team and the man behind the SAP Digital Boardroom built for the SAP HANA Database & Analytics team. According to him, “This active pull is what you hope for any new tool you implement.”
2. “You need meaningful data that everyone can rely on.”
“I have seen many dashboards created with the right intent, but in the end the implementation was not successful because it was largely focused on the tool only,” Cramer shares. “A great product alone will not make a great dashboard – meaningful and reliable data is imperative.”
To facilitate a reliable automated business steering, significant work was put into set-up and clean-up of proper and meaningful master data structures in the background. It is precisely the reliability of data and the combination of the various data sources that creates actionable insights — and thus the added value of the team’s solution.
3. “Last and most important, it needs to be intuitive and fun to use – usability drives adoption”
From the beginning, the navigation experience was top of mind with a consistent approach in all designs and layouts.
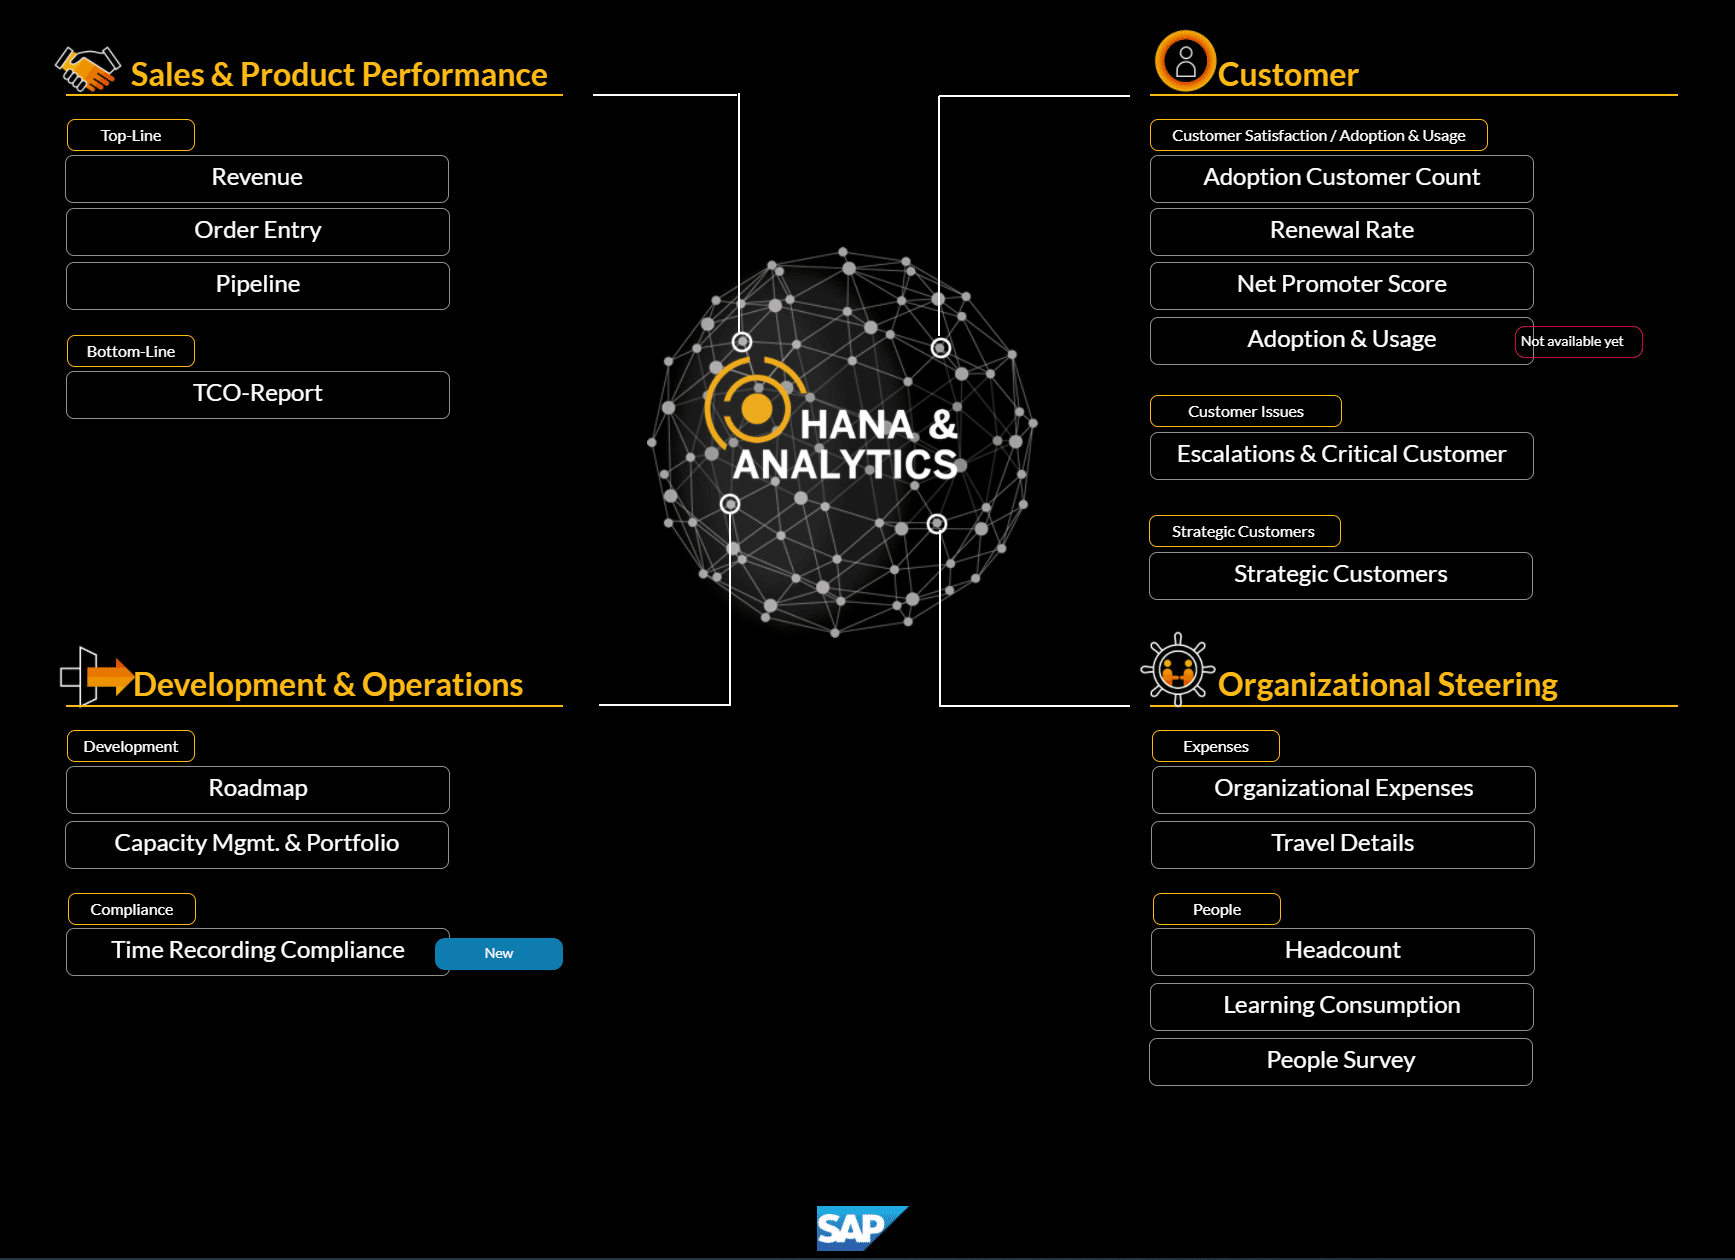
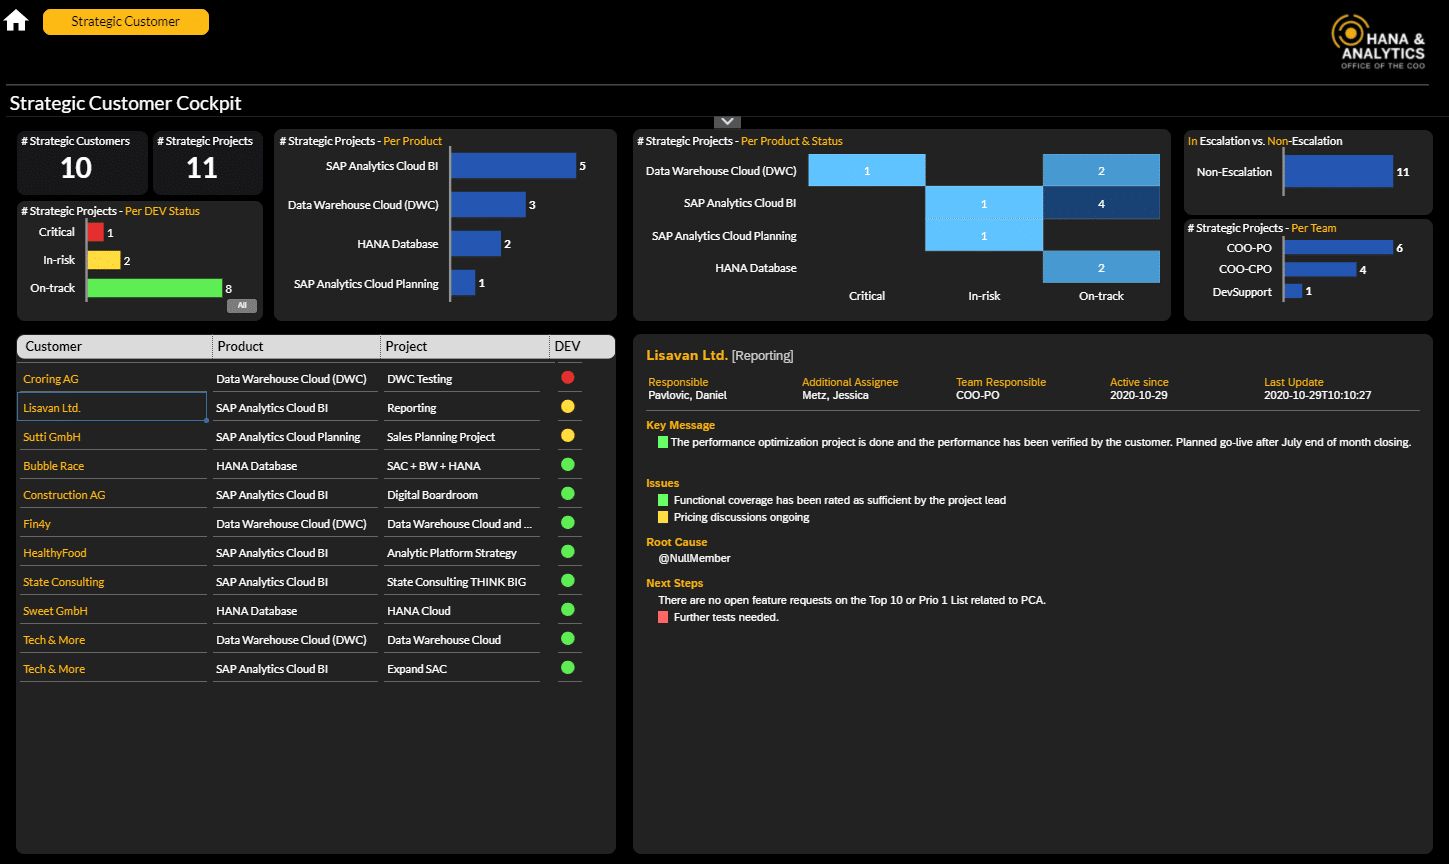
On the landing page, users get a structured overview of all content available and can rely on easy orientation with a navigation bar at the top of each view. Any insight can be found within three clicks, so the user can always recognize a three-layer layout: management summary, enriched view, and full detail view with dynamic filtering function to slice and dice information. A consistent way of illustrating information makes for a great user experience.
To ensure the dashboard serves up what is truly needed, Cramer’s team regularly conducts feedback rounds and usability tests with randomly selected end users and design teams. New views are validated with colleagues creating these reports manually, while first-time users’ clicking behavior provides valuable optimization insights.
Successful Dashboard Creates Adoption
“Having good adoption, you can still add and improve content,” Cramer says. “But if you don’t have adoption, you miss the main criteria of a dashboard: creating business value.”
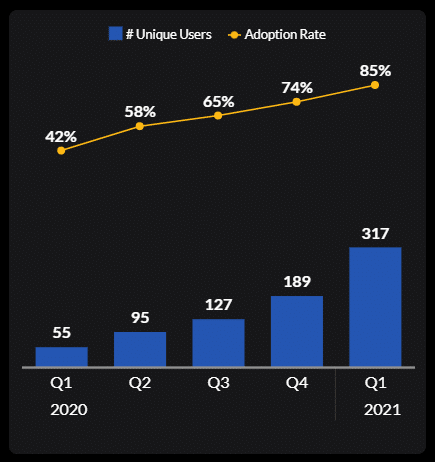
Measured in the number of unique users, the team’s dashboard has already exceeded initial adoption expectations. Unique usage across all areas of the company is consistently increasing, making it one of SAP’s internally used end-to-end line-of-business steering dashboard with the highest user numbers.
“We have a constantly growing internal user base; colleagues in Development, Customer Success, HR, and Finance are looking for great insights,” Cramer says. “And with every addition of content, the number of potential users increases. Most recently, a new time recording compliance view added all our unit’s managers to our user base – that’s around 300 new users!”
To both preview and manage expectations around new content and enhancements, all users regularly receive email updates on what has been added. The dashboard’s usage data clearly shows this proactive method drives adoption.
“We have overwhelmingly positive feedback from all users that the tool is great, the scope of data is second to none and it’s easy to use,” Cramer adds.
Juergen Mueller, chief technology officer and member of the Executive Board of SAP SE, also harnesses the dashboard built by the SAP HANA Database & Analytics organization, led by Irfan Khan. “The SAP Digital Boardroom built by the SAP HANA Database & Analytics team provides me with all relevant information to steer the organization holistically,” he said. “It is easy to use and offers tremendous depth.”
What’s Next?
The team created a tool with a comprehensive level of relevant insights required for any line of business development organization, and the road map for content additions keeps growing. In active use across the SAP HANA Database & Analytics organization for under a year, other SAP internal business units could use it in the future as well.
“The views are adaptable to reflect KPIs of other lines of business with minimal effort,” Cramer explains. “We are currently piloting that with another line of business that started using the available material to adapt it to their own unit.”
SAP Digital Boardroom is included in the 30-day free trial of SAP Analytics Cloud. Try it now!