In 2019, Gartner placed knowledge graphs alongside quantum computing in its Hype Cycle for Emerging Technologies. The reaction from the research community was one of bemusement: knowledge graphs, which are semantics used to search data across multiple sources and forge connections between them, were essentially nothing new.
Even as far back as the 1950s, computer scientists were already experimenting with this concept of data modeling. In the 1980s, knowledge graphs were a much-discussed topic in the context of expert systems, and in the 2000s they once again came to the attention of the scientific community, as they took on a fundamental role in Semantic Web. Finally, in 2012, it was a search engine that gave knowledge graphs their big appearance among a wider audience: Google announced that its users would be able to search for “things not strings.” Rather than just trying to match keywords from a query, the search engine would also place them in the right context – all with the aim of delivering better, more intelligent results.
“Put very simply, knowledge graphs are a technology that seeks to turn data into machine-interpretable knowledge,” says Michael Burwig, innovation engineer at SAP Innovation Center Potsdam. Their key focus is to model the relationships between objects, which are shown as a network of interconnected points.
“Knowledge graphs allow us to map how we humans understand the world – how we go through life, accumulate knowledge, and how we contextualize that information in our minds,” Burwig explains. This ability allows humans to draw conclusions that produce fascinating “aha” moments. Ultimately, this is also the goal of business software: to connect knowledge and find solutions, ideally in an automated way. There are many potential use cases of knowledge graphs, such as knowledge and data management and chatbots. Detecting insurance fraud is one example, but, in short, they can be used in any scenario in which patterns are examined to identify exceptions and anomalies.
The Potential of Hybrid AI
Burwig believes, however, that automated insights like these have not yet become part of everyday practice. “Hybrid AI is a major step in this direction. It combines semantic technology, in other words knowledge graphs, and static machine learning, which is now being used for a host of scenarios of this kind,” he says.
Dr. Jan Portisch, lead architect at SAP Signavio Value Accelerator Delivery, describes the difference between classical machine learning concepts and hybrid AI machine learning as follows: “Classical machine learning methods use extracts of existing databases. These methods draw on such data sets, which are effectively snapshots without any context, to create machine learning content. With knowledge graphs, on the other hand, new data can be added at any time so that they keep on ‘learning’ and, unlike static methods, stay current.”
Even though knowledge graphs are not new, it took the massive increase in computing power that we have seen since the 2000s to unleash their full potential, Portisch explains. And since this technology is not yet widely taught at universities, few developers know much about it. “Another difficulty is that designing graphs is highly complex, with developers having to think beyond their own application. The modeling behind the graphs has to be complete and semantically accurate. Nonetheless, their potential is huge,” he says.
As an architect, Portisch is involved in creating a central graph for process knowledge at SAP. The SAP Signavio Value Accelerator Delivery team collates and models the process knowledge SAP has built up over the past 50 years to give customers an integrated view. In the future, the accelerator will offer a semantic search where users will be able to formulate a business problem they’d like to solve and the system will display a list of processes and data that are impacted by this problem, Portisch explains. Further, this capability could be a helpful transition tool in migration projects or could provide presales teams with the visibility they need when tailoring solutions to customers’ specific situations.
Felix Sasaki, expert in Knowledge Graphs & Semantic Technologies in the SAP AI unit, explains additional benefits: “Standards-based knowledge graph technologies facilitate the modeling of business scenarios. So-called constraints complement the existing logic-based modeling. Since constraints can easily capture the knowledge of business experts, modeling becomes easier. In addition, knowledge graph-based vocabularies like schema.org have found widespread adoption and thus help to find a more ubiquitous language.”
Decoupling Business Expertise and Application
For SAP, the power of this technology lies in how graphs can be combined in different ways and, therefore, in how data models – and ultimately the applications themselves – can be integrated and composed.
Portisch explains how it’s important to recognize that RDF – Resource Description Framework, a syntax used to model metadata for Internet resources – is a publicly acknowledged standard and that knowledge graphs are already widely used outside the corporate world. One of the best-known knowledge graphs is wikidata; another example of a large-scale graph is DBpedia. “These graphs are public resources that can also be used commercially,” Portisch says.
That creates interesting use cases. For example, private corporate data could be combined with public data. A supplier system running on SAP software could automatically import metadata from a graph about companies it interacts with, such as the type of business, company logo, and who their managing directors are.
“Semantic Glue” – Integration by Design
Burwig sees another advantage of these graphs in their “semantic glue.” Because of their flexible structure that can be enhanced in real time, individual graphs can be “glued” together to link up data silos. Unlike graphs, the table structure of a relational database has to be defined at the beginning – and changing that structure later requires a lot of work. But graphs can store and link metadata in a semantic data layer that is separate from the data stored in an application’s tables. This makes it possible to consolidate data across different products and data silos.
Graphs offer huge advantages over relational databases in certain scenarios, such as calculating the shortest route or associating a specific material with a customer material. “If such a scenario is based on a relational database, the query would have to touch applications from across the entire SAP world. But with a graph, it would be a simple problem to solve,” Portisch says. While relational databases usually offer greater performance within their applications, graphs always have an advantage when it comes to creating bridges, known as joins, between data structures and recognizing the correct context.
Because it is possible to extend knowledge graphs, they represent a perfect data model for businesses to start small with and then, as an iterative process, to roll out to more locations and build on. For example, a company could begin with just one use case or department and then gradually roll the model out to the rest of the organization. Any additional data models are “glued” to the graph as new nodes and edges.
The Situation Knowledge Graph: One of the First Knowledge Graphs at SAP
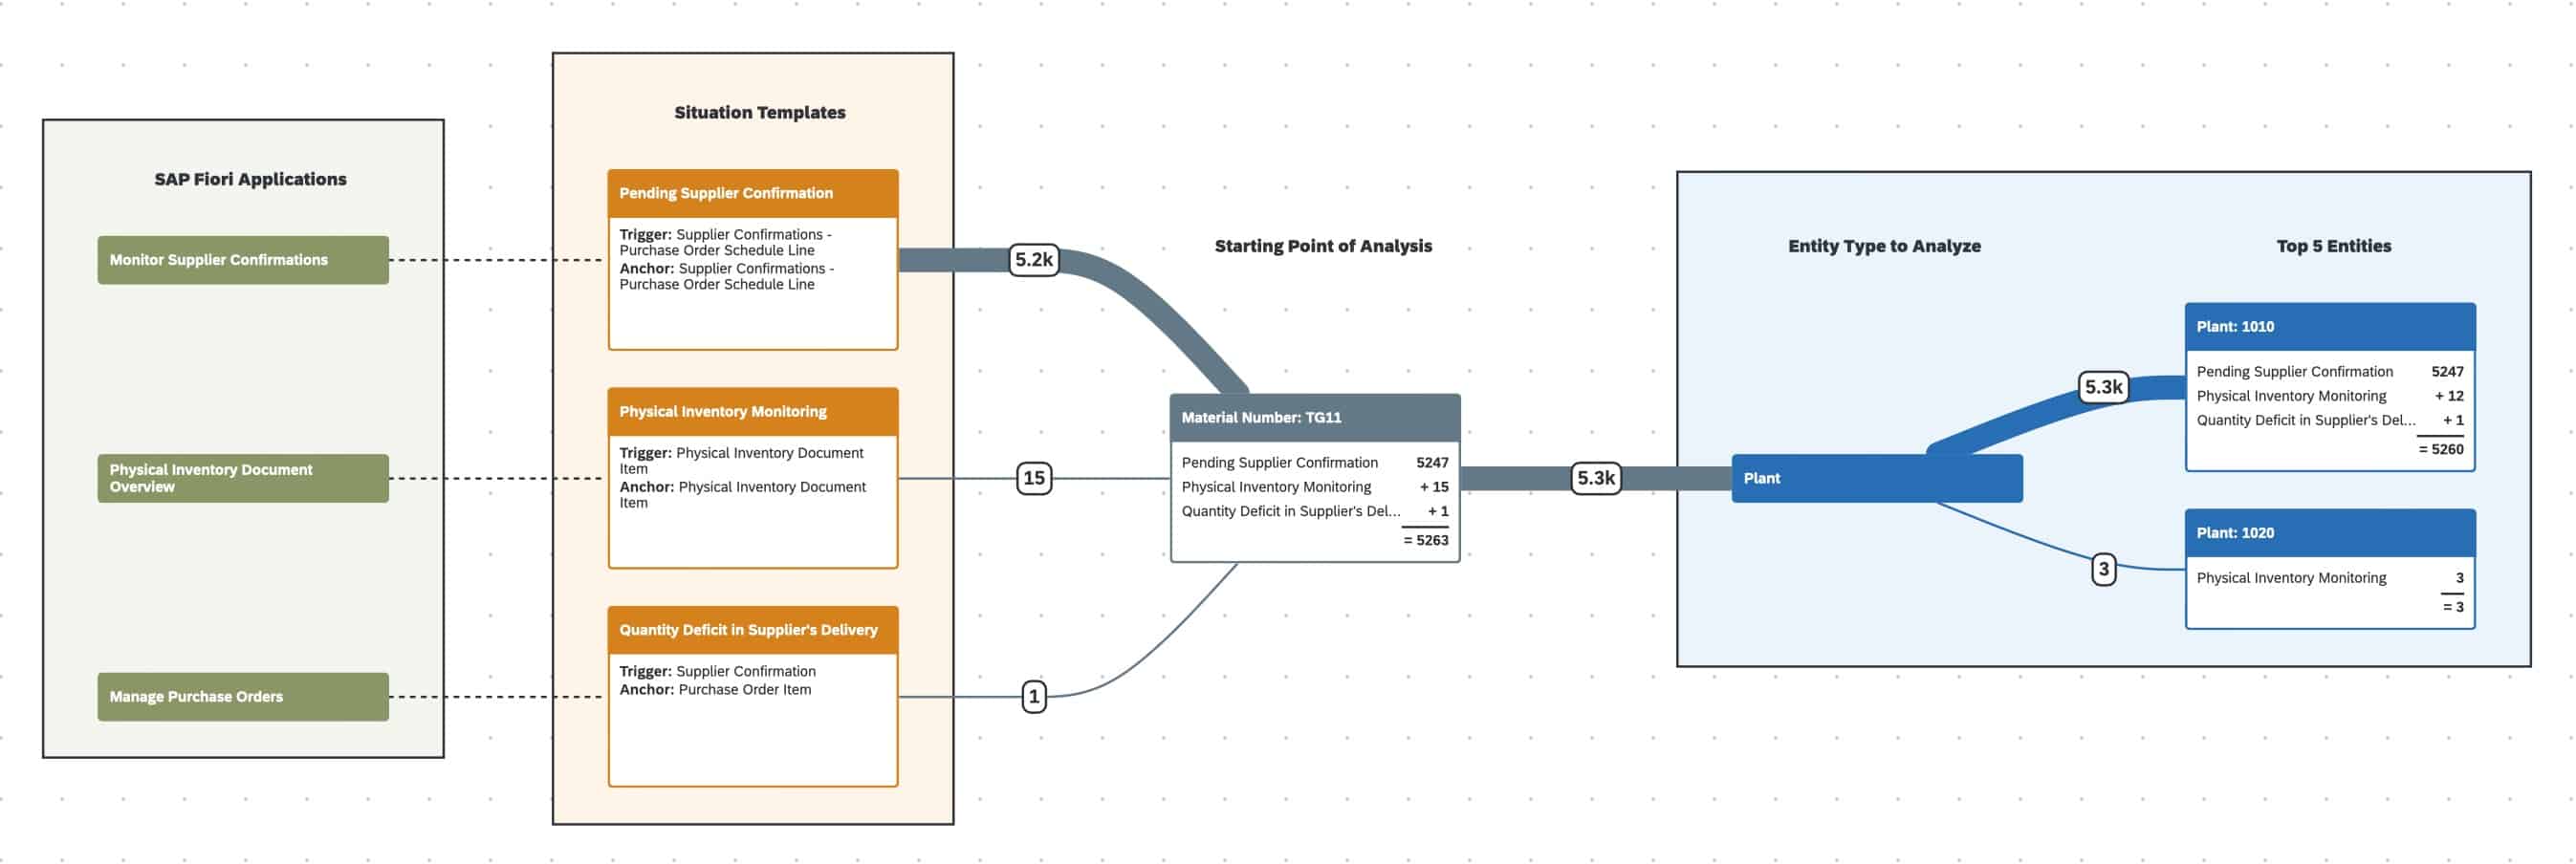
One of the most advanced knowledge graphs to date at SAP serves as the basis for the Explore Related Situations app, which is part of the Intelligent Situation Automation service on SAP Business Technology Platform (SAP BTP) for situation handling in SAP S/4HANA.
The business background: around 4% of the automated business processes within a business require manual intervention because of an unforeseen event, such as a late payment, a delayed delivery, or a transport issue.
The situation knowledge graph links these exceptional events to their business entities, enabling the user to better understand the situation in a business context and therefore helping solve the problem and optimize business processes. Further analyses of these situations often reveal relations of issues to certain materials or partners. “Today, this kind of knowledge is often hard-coded,” says Dr. Torsten Leidig, an architect in SAP’s Situation Handling team. The knowledge graph that underpins the Intelligent Situation Automation service enables a business expert or a key user to model processes and understand them within a comprehensive business context. A problem that has been detected can be resolved automatically based on simple rules and without additional programming.
Dr. Knut Manske, engineering lead for Situation Handling and Responsibility Management at SAP, describes the graph as a layer that stretches across various SAP applications. To summarize the capabilities of situation handling, he explains: “The knowledge that is embedded in SAP applications is extracted and made usable for algorithms. Situation handling runs alongside the application, analyzing data and reacting to information about data changes or events. The aim is to show solutions that span various applications or business areas.” Customers and partners can define situations themselves without ever touching the application. A selected group of customers is currently validating the solution.
Looking Ahead
Currently just a prototype, the SAP “Business Decision Simulator” innovation project simulates the effects of internal and external factors on a company and presents the user with potential future scenarios and recommended responses. “One possible question could be: what does a bushfire in Australia mean for my global pharmaceutical company’s value chain and thus the achievement of our targets in Europe?” Burwig explains. “On the one hand, knowledge graph technology can help express the complex relationships between real-world events and business-related processes. Additionally, an extensive knowledge base makes it easier for the user to choose the best possible response to opportunities and risks.”
When asked about the possibilities of graph technology, Burwig says: “The potential of knowledge graphs – at least that’s the dream – is that someday there will be extensive graphs modeled on deep knowledge and experience that can be accessed by programs. This means that with every change in technology, we’d only have to recode the application and not the knowledge stored inside it.”
While the decoupling of data from applications and the accompanying scalability of solutions and programs are important aspects for an IT company, Burwig also sees a vision that goes beyond the SAP context: symbolic AI, artificial intelligence that is linked to a large number of interdisciplinary knowledge networks, could have the potential to generate new knowledge that has not been explicitly modeled. Linking scientific content could have the power to accelerate the discovery of new drugs or forge innovations between different science disciplines that don’t interact on a large scale today.
In the history of humanity, things have often been – and still are today – “invented” multiple times, at least in part from lack of knowledge about other relevant findings. Connecting global research projects within one given discipline has increased sharply within the past years, thanks to the availability of extensive digital content. Uniting scientific knowledge across the individual disciplines – for example, mathematics, biology, medicine, and chemistry – could uncover new insights and lead to exciting interdisciplinary inventions, Burwig concludes.
The Virtuous Circle Between Knowledge Graphs, Machine Learning, and Natural Language Processing
Academic communities of symbolic AI and machine learning in the past had few touchpoints in terms of research methods and researchers. This is changing – among others leading to so-called hybrid AI. This results in various virtuous cycles in which knowledge graphs, machine learning, and natural language processing (NLP) cross-pollinate each other. Johannes Hoffart, head of the Chief Technology Office in the AI Unit at SAP, explains the relation between machine learning and knowledge graphs: “Knowledge graphs enable data scientists to work with complex and heterogeneous data sources. Their flexible schema can be easily extended and contains powerful data validation capabilities. At the same time, knowledge graphs facilitate access to and exploration of data, as they represent data and its schema such that it’s easier for humans, and also large language models, to understand.”
Christian Lieske from SAP’s Language Experience Lab adds about the relation to natural language processing: “Knowledge graphs can feed NLP and can be fed by NLP. Take the detection of new business entities as an example: a knowledge graph can inform NLP about known entities and NLP can add additional entities to a knowledge graph.”
To get further insight around knowledge graph technology, read this study co-authored by Portisch: Combining Machine Learning and Semantic Web: A Systematic Mapping Study.